Oil on the warpath. Who makes money from war?

 By Marek Grzybowski
The war in Ukraine continued to drive demand for seaborne oil in 2023. Despite high oil prices and the risk of economic recession, many countries buy oil in stock and drive up prices. This year, it is mainly capsize operators that benefit from this. Although operators of other tankers also complain about it.
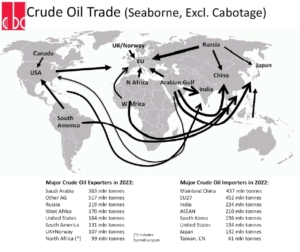
In 2022, over 55% of Northwest European oil exports were loaded on Aframax vessels, 34% on Suezmax and 9% on VLCCs. In 2023, the proportions have not changed much. In the period from January to August 2023, global crude oil supply at loading ports increased by 7% y/y to 1,440.7 million tonnes, excluding all cabotage trade, according to Maritime Refinitiv data based on data from tracking oil tankers .
This was well above the 1,346.5 million tonnes that were loaded on tankers in January-August 2022 and significantly exceeded exports in January-August 2021, when supply reached 1,240.3 million tonnes. For comparison, high supply crude oil (1,397.3 million tonnes) was recorded in the same period of 2019.
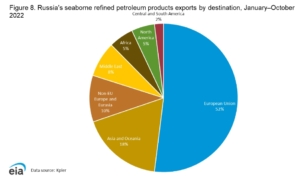
Exports from the Persian Gulf increased only by 0.4% y/y to 581.0 million tonnes in January-August 2023. However, they accounted for 40.3% of the global share in the maritime oil trade market. Russia has also taken advantage of growing demand for oil and opened new sea supply routes. As a result, Russian oil exports increased by 4.7% y/y to 154.8 million tons, providing 10.7% of the supply on the sea routes of global oil trade.
USA – highest exports since 1981
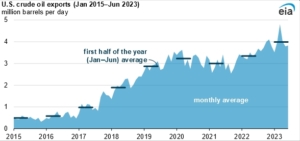
– Total U.S. exports of petroleum products in the first half of 2023 amounted to almost 6 million barrels per day (b/d). This is 2% more than in the same period in 2022, reports U.S. Energy Information Administration (EIA) and emphasizes in the latest report that “In the first half of 2023, over the first six years, U.S. exports of petroleum products were the highest since 1981,” which is the time of collecting monthly data for EIA’s “Petroleum Supply Monthly” reports “. As a result, oil supplies from the USA increased by 19.9% y/y to 126.4 million tonnes in the first half of this year. from West Africa, oil exports increased by 0.5% y/y to 115.5 million tonnes.
Almost a quarter of the demand is generated by the Chinese economy. China’s seaborne imports increased by 23% y/y to 341 million tons in January-August 2023, accounting for 23.6% of global trade in this energy raw material.
– After a strong increase in imports of energy raw materials to the EU in 2021-2022, the scenario has completely changed in 2023. Imports are falling for the second quarter in a row compared to the same period of the previous year, Eurostat informs in its report for the second quarter of 2023.
However, in the second quarter of 2023, compared to the corresponding quarter of 2022, imports to the EU decreased by 39.4% in terms of value and 11.3% in terms of net weight (in tonnes). These results follow declines of 26.5% and 6.1%, respectively, in the first quarter of this year, Eurostat analysts calculated.
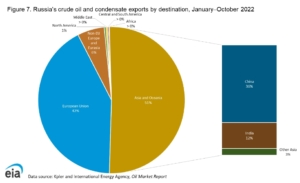
Russia – supply to the EU drops by 82%
In terms of net supply, Russia’s share of crude oil and natural gas imports to the EU has been declining steadily since the second quarter of 2022. Crude oil imports from Russia fell from a monthly average of 8.7 million tonnes in the second quarter of 2022 to 1.6 million tonnes in the second quarter br. This means an 82% reduction in deliveries. These declines were compensated by imports from non-EU partners, which increased by 5.8 million tonnes, from 31.5 million to 37.3 million tonnes, according to Eurostat.
As for crude oil, let us recall that on December 5, 2022, the EU ban on the import of Russian oil by sea came into force, and from February 5, 2023, an embargo on refined petroleum products was introduced, which affected the results of the first and second quarters of 2023 .
If in the second quarter of 2022 Russia was the leading supplier of crude oil, with a share of 15.9% of total imports to the EU, then in the second quarter of 2023 Russia was only in 12th place with a share of 2.7%. . And this means a decrease of 13.2% compared to 2022.
Oil in the Atlantic and Mediterranean Sea
Russia’s place was taken by suppliers from other countries. Oil and natural gas began to flow by tanker from the North Sea and the Gulf of Mexico and other regions. Norway increased deliveries by 3.5% and its EU market share increased to 13.7%. Kazakhstan increased deliveries by 3.2% and its share in the EU market reached 10.2%. The United States also benefited.
Tankers with American oil sailed across the Atlantic to Europe and there was 2.1% more oil, increasing the share to 13.6%. Saudi Arabia increased its oil supply by 2.3%, and its share reached 9.0%. Libya has also become an important partner of EU countries. This country currently accounts for 8.1% of crude oil imports to the EU, according to Eurostat calculations.
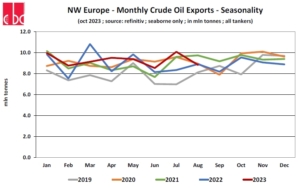
Oil supplies by sea from Northwest Europe, i.e. Norway and Great Britain, accounted for 5.2% of global crude oil transports by sea in 2022. Crude oil supplies from Norway and the UK increased by 12% y/y in 2020 to 110 million tonnes, excluding cabotage and sea shuttle transport.
For comparison, it is worth noting that in 2021, seaborne crude oil delivery volumes remained broadly stable, declining by 0.5% y/y to 109.5 million tonnes. In 2022, exports from Northwest Europe decreased by 1.9% y/y to 107.4 million tonnes. This was the lowest supply level since 2019. In the first 8 months of 2023, Northwest Europe exported 74.3 million tonnes of crude oil, up 3.6% y/y from 71.7 million tonnes in the same period of 2022 r. The embargo on Russian oil allowed the revival of production towers in the North Sea and increased their profitability.
Recovery in the North Sea
Exports are back to normal. Supply from North Sea oil rigs was almost perfectly split equally between the two countries in 2020. However, in 2022, Norway exported 68.9 million tonnes, while the UK exported just 38.5 million tonnes of crude oil.
The main crude oil export points in Northwest Europe are: Mongstad (26.5 million tons loaded on ships in January-December 2022), Sture (11.7 million tons), Hound Point (10.5 million tons), Gullfaks Platform (9.2 million tons), Teesport (6.8 million tons), Sullom Voe (4.3 million tons), Scapa Flow (3.7 million tons), Stratfjord Platform (3.1 million tons), Hanne Knutsen (2.9 million tonnes), Asgard A FPSO (2.7 million tonnes), Alvheim FPSO (2.5 million tonnes) million tonnes), Glen Lyon FPSO (2.0 million tonnes).
In 2022, over 55% of Northwest European oil exports were loaded on Aframax vessels, 34% on Suezmax and 9% on VLCCs. About 16% of North Sea oil cargo, or 17 million tonnes in 2022, is regional and destined for other ports in Norway and the UK. Shuttle tankers carry cargo from oil rigs to onshore terminals, from where they are sometimes, but not always, reshipped to destinations at other fuel terminals.
The main recipient of Norwegian and British crude oil is a group of EU countries. In 2022, a total of 77.4 million tonnes, or 72% of demand, were shipped to the European Union. The main recipients were terminals in the Netherlands (25.2 million t in 2022), Sweden (14.6 million t), Germany (10.5 million t), and Poland (6.7 million t). In 2022, deliveries to the EU27 increased by 19.9% y/y.
China is also a recipient of oil from the North Sea. 6.1% of all deliveries from Norway and Great Britain went there, i.e. 6.6 million tonnes in 2022. This is much less compared to the highest level of deliveries in 2020, when tankers delivered 19.9 million tonnes to the Middle Kingdom. Yes so deliveries from the North Sea to China decreased by 56.5% y/y in 2022. 1.3% of exports, or 1.4 million tons in 2022, were sent to South Korea. 0.8%, or 0.9 million tonnes in 2022, was sent to Southeast Asia.
Summary
Rising oil prices are driving US drilling and production on North Sea and Persian Gulf platforms. Shuttle tanker traffic and intercontinental connections continue despite rising prices. Russia has done a great job of bypassing sanctions. Other producers took advantage of the opportunity and increased supplies to crude oil customers. They were joined by tanker operators, forwarders and freight forwarders, banks and insurance companies and, of course, operators of shipping and receiving terminals in seaports. Once again it turned out that there is a war and an opportunity to do business.