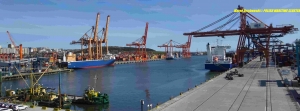
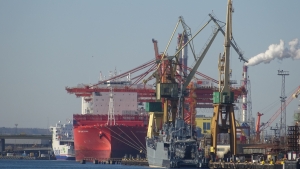
The carbon footprint of maritime transport is decreasing. But too slow

![]()
 By Marek Grzybowski
The carbon footprint generated by fleets operating in container transport decreased in the first quarter of 2023 on 10 out of 13 busiest liner services, according to the latest analysis of Xeneta experts. The largest emissions were recorded on ships serving the west coast of the United States to the Far East. Operator Yang Ming, who “became an emission hero” in the industry, stood out positively for the “second quarter in a row”, emphasizes Emily Stausbøll from Xenet.
Carbon Emissions Index
Carbon Emissions Index (CEI) * used by Xenet and Marine Benchmark to measure CO2 emissions from ships burning fossil fuels. It is based on real-time AIS data and assessment of vessel characteristics. Xeneta and Marine Benchmark keep track of ship movements on the most active commercial routes.
Analysts calculate the environmental impacts per tonne of cargo carried by ships serving services using the most active trade routes. The base of calculations (index 100) adopted for the assessment is the emission assumed for an average line service. It is based on data collected in early 2018.
– These results showed a quarterly improvement in many transactions in early 2023, comments Emily Stausbøll, Xeneta Shipping Analyst, but warns that it is not known whether this trend will continue. He notes that it’s not just environmental commitment that lowers CEI scores. In many cases, these are business decisions.
Progress too slow?
Xeneta has been using metrics for some time to assess sea carriers operating on sighted transport routes between ocean ports. Stausbøll notes that the improvement in performance and the reduction of CO2 and greenhouse gas emissions are due to the reduction of speed by hauliers. This provides them with marine fuel savings while allowing them to meet much lower demand [for transport services – MG] “in a subdued macroeconomic climate.”
– From the west coast of the United States to the backhaul belt, the speed decreased by almost 1 knot, which, combined with the increase in ship size and stable load factor, enabled the CEI to improve by 11.3% from the fourth quarter of 2022 – stresses Xeneta analyst.
Decarbonization in the Far East services
Despite the favorable trend, the long-term outlook is unpredictable. Four sites reported lower CEI performance in Q1 2023 compared to Q1 2018 emissions factors. Sea freight from the Mediterranean Sea to the US East Coast is bottom of the barrel and CEI is 13.6% higher At the other end of the scale, the ‘star’ is the liner corridor from the Far East to US East Coast ports, with a 21.2% improvement over the same period.
‘Overall, we’re seeing some positive progress,’ states Stausbøll, ‘and many carriers are getting the right balance between ship speed, size and load factor.’
“Yang Ming is the best carrier in terms of progress in reducing greenhouse gas emissions,” concludes Stausbøll. The Taiwanese operator recorded the best progress in reducing CEI in Q4 2022. The Taiwanese giant was the cleanest carrier (measuring CO2 emissions per tonne of cargo carried) on three routes.
The Carbon Emissions Index (CEI) is examined by Xenet analysts on 13 main maritime transport corridors:
Far East – Mediterranean
Far East – North Europe
Far East – S. America E. Coast
Far East – US East Coast
Far East – US West Coast
Mediterranean – Far East
Mediterranean – US East Coast
North Europe – Far East
North Europe – S. America E. Coast
North Europe – US East Coast
US East Coast – Mediterranean
US East Coast – North Europe
US West Coast – Far East
More: