Polish foreign trade reached EUR 691.5 billion in 2023. Polish seaports have record turnover in the Baltic Sea
 By Marek Grzybowski
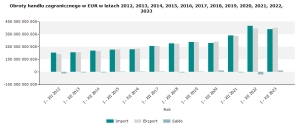
Polish exports in 2023 amounted to EUR 351 billion, and the value of products imported to Poland approached EUR 340.5 billion – the Central Statistical Office reported in mid-February this year. In 2023, there was a slight decrease in the value of goods and services exported to European Union countries. Exports to developing countries increased significantly.
This is a trend that was already present in the first three quarters of this year, when exports amounted to EUR 293.5 billion and imports to EUR 283 billion. Increases were recorded in exports by 2.5%, and imports decreased by 6.7%. The positive balance amounted to EUR 10.6 billion, while in January – October 2022 it was negative and amounted to EUR 16.9 billion.
Maritime industries create export
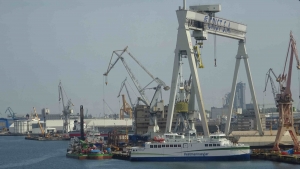
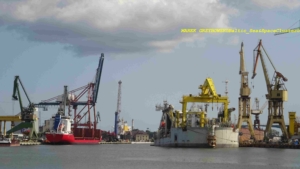
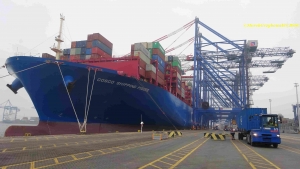
Seaports, shipyards, producers of fish products and forwarding, agency and logistics companies operating in the broadly understood maritime economy contributed significantly to the increase in foreign trade turnover. Polish seaports in Gdynia, Szczecin and Świnoujście occupy an important position on the maritime map of the Baltic Sea. In 2023, Gdańsk outperformed all ports in terms of transshipment dynamics, as we wrote about.
The annual sales of Polish maritime enterprises amount to approximately PLN 125 billion, or approximately EUR 30 billion. In most cases, production is exported or strongly linked to the international market. The value of ship repairs alone is estimated at approximately EUR 230 million annually. The sales value of finished ships and hulls is EUR 1,350 million. The sales value of yachts and motorboats is approaching EUR 530 million.
Maritime and seaside tourism brings significant revenues. If we assume that each of these 5.8 million tourists spends on average about EUR 90 per day, each week’s stay brings considerable revenues to our economy. The budget also receives transfers and taxes from officers and sailors sailing on merchant and offshore ships, shipyard workers and employees of fish processing companies working abroad, and employees of foreign companies providing services to maritime economy companies.
In 2023, a positive balance of over EUR 10 billion
The income of Polish exporters in 2023 was 1.4% higher than in 2022 – informs the Central Statistical Office. We managed to achieve a surplus of trade revenues of over EUR 10.58 billion. In 2022, a negative balance was not avoided, amounting to almost EUR 20 billion, with exports exceeding EUR 346.2 billion. Last year, imports calculated by country of origin amounted to EUR 340.46 billion and was 7% lower year-on-year, when over EUR 366.2 billion (EUR 289.6 billion in 2021) was spent on imported goods and services.
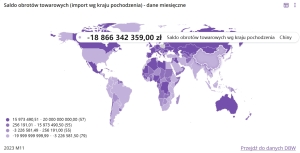
A negative balance was recorded with developing countries in the first 3 quarters of 2023. It reached PLN 303.8 billion (EUR 66.1 billion). A positive balance in foreign trade turnover was achieved in turnover with other groups of countries. With the countries of Central and Eastern Europe PLN 38.5 billion (EUR 8.4 billion), with developed countries PLN 313.9 billion (EUR 68.2 billion). With EU countries, the positive balance amounted to PLN 308.9 billion (EUR 67.1 billion) over the 3 quarters of 2023.
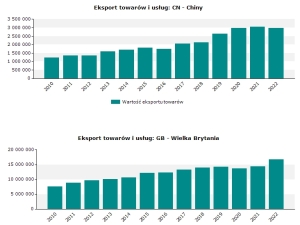
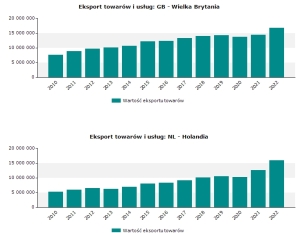
In 2023, there was a decline in exports to European Union countries. Polish companies exported goods and services to EU markets worth EUR 262.2 billion. This is approximately 0.1% less than in 2022. Sales to developed countries increased by 0.5% in 2023 and reached EUR 303.6 billion. The share of developed countries in imports of products and services decreased by approximately 1% to 86.5%. The demand for Polish products on EU markets also decreased; in value terms, EU buyers for Polish products accounted for 75.8%.
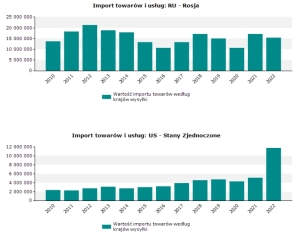
These main trends could be observed by observing changes from January to October 2023. In imports compared to January – October 2022, there was a decrease with China by 14.1%, Germany by 9.8%, Italy by 5.1%, and the United States United States by 5%, Belgium by 4.9%, the Czech Republic by 2.5%, and the Netherlands by 2.2%. In exports, increases were recorded among Poland’s main trading partners compared to the same period in 2022.
Import record holders
For many years, Germany has been the largest importer of goods from Poland. Last year they were purchasers of 27.9% of goods and services. Their total value amounted to EUR 98.1 billion. Germany’s share in exports increased by 0.1 percentage points compared to January – October 2022. and amounted to 28%, and in imports it decreased by 0.5% and accounted for 19.8%. The positive balance amounted to PLN 119.4 billion (USD 28.1 billion, EUR 26.0 billion) compared to PLN 85.8 billion (USD 19.5 billion, EUR 18.4 billion) in the corresponding period of 2022.
In 2023, exports to developing countries increased by 7%, reaching a still low value of EUR 29.2 billion. This was due to the increase in shipments to Central and Eastern European countries. In this case, 8.4% growth resulted in sales worth EUR 18.2 billion.
From January to October last year. 86.7% of Polish exports went to developed countries. Buyers from these countries purchased goods and services worth EUR 227.3 billion. Goods and services worth EUR 155.5 billion were delivered directly to euro area countries. They increased by 2.5% y/y. The share of developing countries’ exports was 8.3%. Its value increased by 8.8% to EUR 21.8 billion.
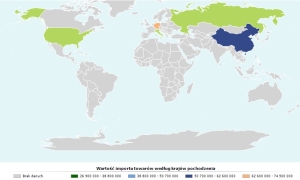
Germany, China and others
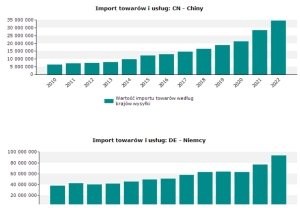
The Polish market was dominated by goods and services from Germany. In 2023, we imported goods and services worth EUR 67.5 billion from this direction. The second largest suppliers are companies from the PRC, from which we imported EUR 47.4 billion. Goods and services worth EUR 16.5 billion reached the Polish market from Italy.
In 2023, we recorded declines in six leading markets. The largest one was in the case of China – 12.1%. Poland’s imports from South Korea increased by one tenth, and imports from Norway increased by almost 70%. From South Korea we imported weapons, cars and electronics.
From Norway, crude oil, weapons and ship equipment, which we then exported to Scandinavian markets. As a result, the share of the latter country in Polish imports increased from 1.3%. in 2022 to 2.4 percent last year
Export and import – do we live on beverages and tobacco?
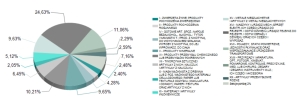
In exports, the largest increase in the shipment of goods occurred in the group of beverages and tobacco (by 17.9%), machinery and transport equipment (by 5.7%), and food and live animals (by 4.7%). The value decreased, among others: unclassified goods and transactions (by 34.4%), mineral fuels, lubricants and derived materials (by 19.2%), inedible raw materials – except fuels (by 15.7%), oils, fats and animal and plant waxes (by 10.6%).
Our market increased the demand for imports of beverages and tobacco (by 13.8%), food and live animals (by 4%), and machinery and transport equipment (by 2.8%). The largest decline was recorded, among others, in the import of oils, fats, inedible raw materials, mineral fuels, lubricants and related materials.
The statistics quoted above also reflect the activity of maritime companies. Record port transshipment reflects the activity of our companies on the international market, as well as the activity of our economy. Many parts imported to Poland by sea reach the markets in the form of assembled, finished products.
Despite the dynamically developing ports and the extremely active Pomeranian Special Economic Zone, there is still a lack of export activity in Pomerania. In the PSEZ space and around ports there is room for business development based on the refining of goods and re-export. It has been known since the times of the Phoenicians that international trade is a source of wealth. So all that’s left is to get rich and improve your statistics.